Real-Time Airline Price Tracker and Pre-Earnings Revenue Estimates
The airline industry is fast-moving. Macro-economic factors can impact demand for airline flights year to year and the financial performance of different airlines can diverge substantially based on the competitive environment in the routes they fly. What makes the airline industry attractive to financial analysts is that ticket prices are publicly observable on a daily basis. By tracking ticket prices in real-time, investors can gain an understanding of how each airline is doing before they report earnings. At Differentiated Analytics, we track the ticket prices of the 10 most important publicly-traded US airlines in real-time. In this report we will describe the competitive and regional positioning of each of the 9 airlines we cover, and how our proprietary real-time ticket price data can be used by airline investors.
Introduction to Domestic US Airline Industry
The airlines we track include the big three international carriers; American, United, and Delta, the large budget airlines Southwest and JetBlue, the regional airline Alaska, and the ultra low-cost airlines; Spirit, Frontier, and Sun Country.

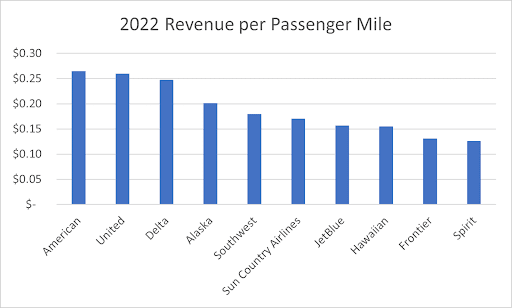
The big three; American, United, and Delta tend to charge the highest ticket prices, leading to higher revenue per passenger mile. Alaska is also very expensive due to the relatively little competition for routes to Alaska. Frontier and Spirit are the cheapest, charging very low fares.
In terms of geographical focus most of the airlines serve a broad range of routes across the domestic US market, with the notable exception of Alaska which focuses on flights between Alaska and the west coast of the United States.
Historically air travel has been a low-growth industry in terms of volume. Between 2005 and 2016 aggregate US passenger volume increased at a compound annual rate of just 2% per year. Between 2016 and 2019 growth accelerated to 9% per year. Between 2005 and 2022 the number of US passengers increased at an annual rate of 2.5% per year. Aggregate US airline revenue increased at a rate of 3.7% per year. Thus, the average ticket price has only increased by 1.2% per year which is less than inflation. The highly competitive nature of the industry makes it difficult for airlines to raise prices significantly over time
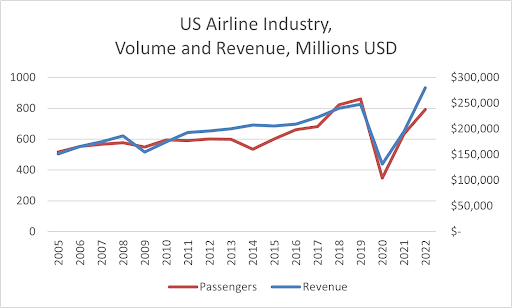
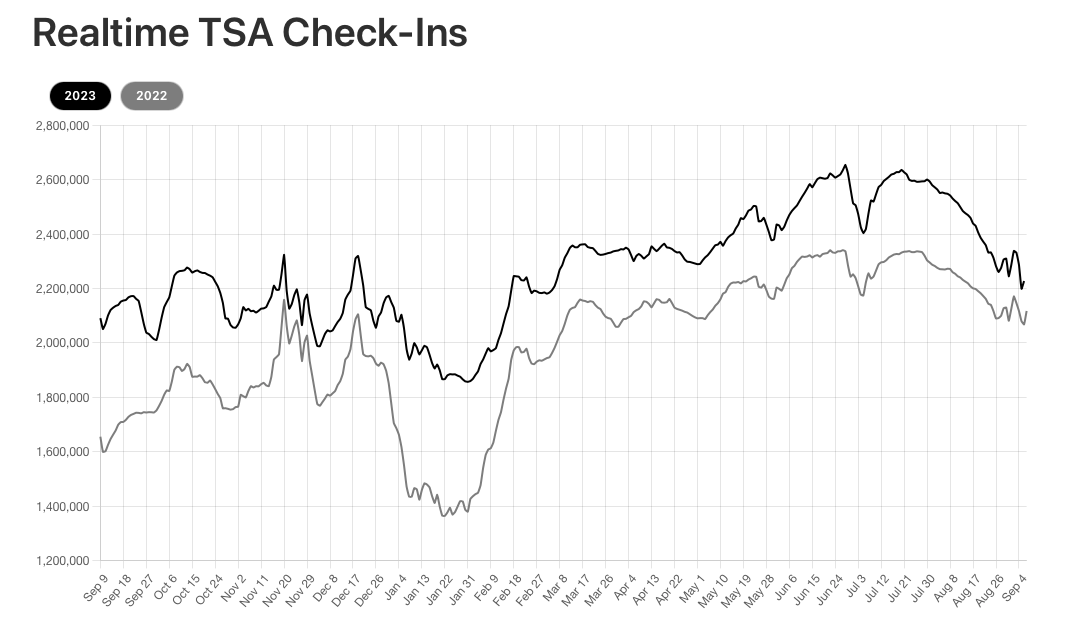
The pandemic caused an unprecedented 60% decrease in passenger volume in 2020. As pandemic-related restrictions were lifted the industry recovered rapidly. In the first 8 months of 2023, total airline volume was marginally higher than in 2019. The Transportation Safety Agency publishes how many passengers it checks in every day. This provides a real-time data source for the overall health of the domestic US airline industry.
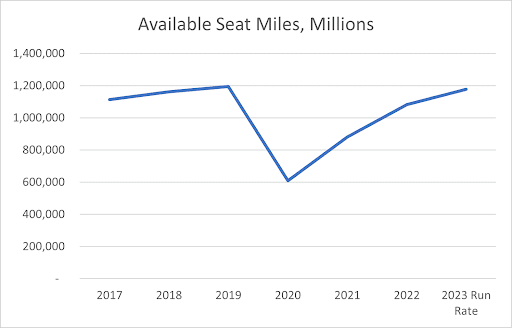
In response to the Pandemic, airlines decreased capacity by retiring old aircraft, terminating leases, and putting existing aircraft in storage. This led to a ~50% decrease in available seat miles in 2020. Available seat miles is the total miles flown multiplied by the number of available passenger seats.
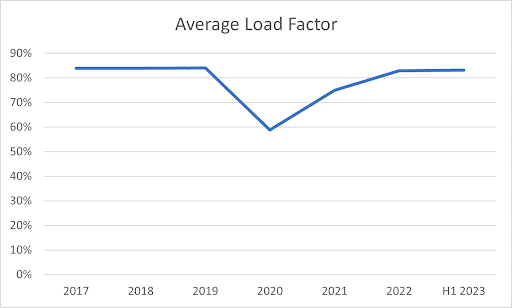
Despite the large decrease in capacity, US airlines still suffered from substantially decreased capacity utilization during the pandemic. This can be seen in the load factor which is the percentage of seats on all flights that are occupied. Prior to the pandemic the load factor was stable at ~84%. In 2020 it collapsed to 59%. As the pandemic ended the load factor gradually recovered. By the first half of 2023 the average load factor of the airlines we track has recovered to 83%, just shy of pre-pandemic levels.
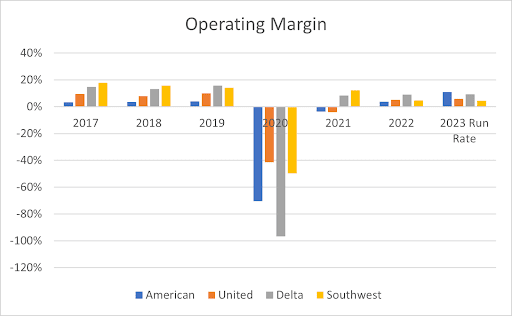
All of the airlines we track were profitable or at least breaking even pre-COVID. Unsurprisingly, they swung to substantial operating losses in 2020. By the first half of 2023 the operating margins of most airlines had recovered to positive territory. But we see a substantial deviation between the larger and smaller airlines. The 4 largest airlines; American, United, Delta, and Southwest, all have positive operating margins.
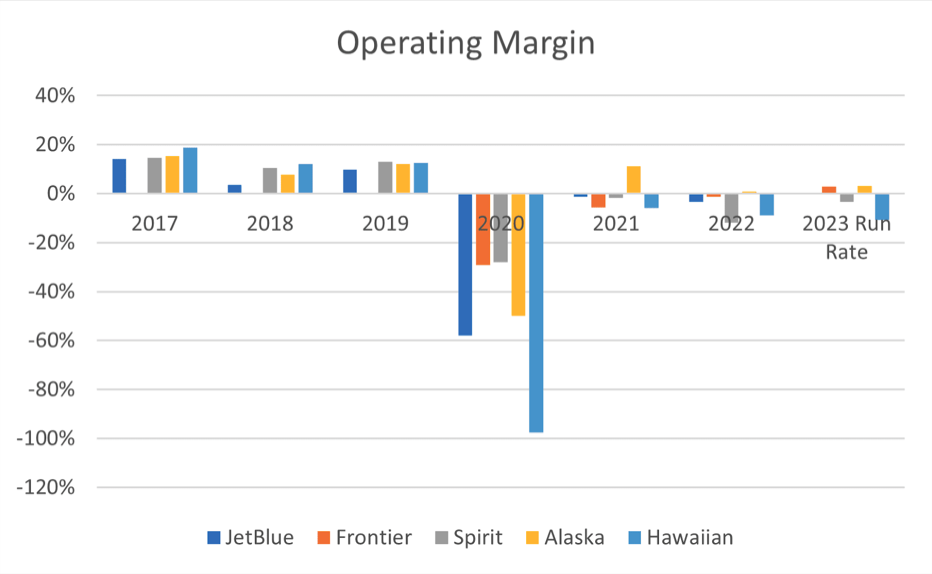
The smaller airlines aren’t doing as well. Jetblue, Spirit, and Hawaiian airlines are still making operating losses as of the first half of 2023.
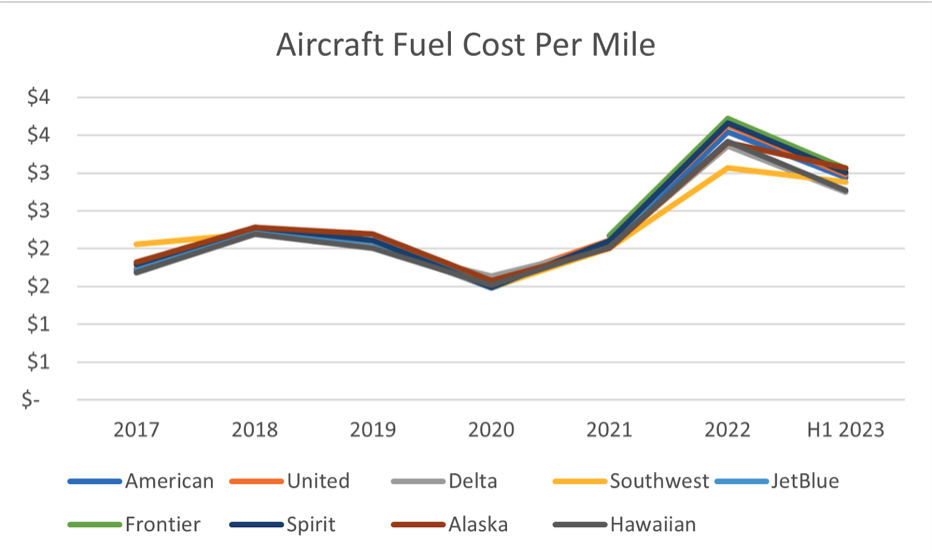
Part of the culprit behind decreasing profitability is a substantial increase in the price of aviation fuel, which closely tracks the price of crude oil. Fuel can represent as much as 30% of an airline's total operating costs.
Airlines have compensated for higher fuel costs by increasing ticket prices. Revenue per revenue passenger mile represents the revenue an airline generates for each mile that a passenger is flown.
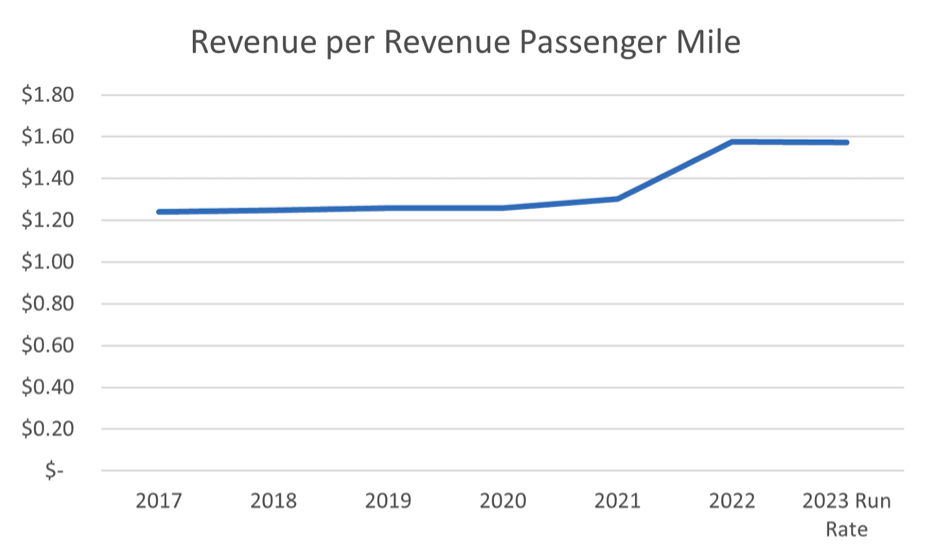
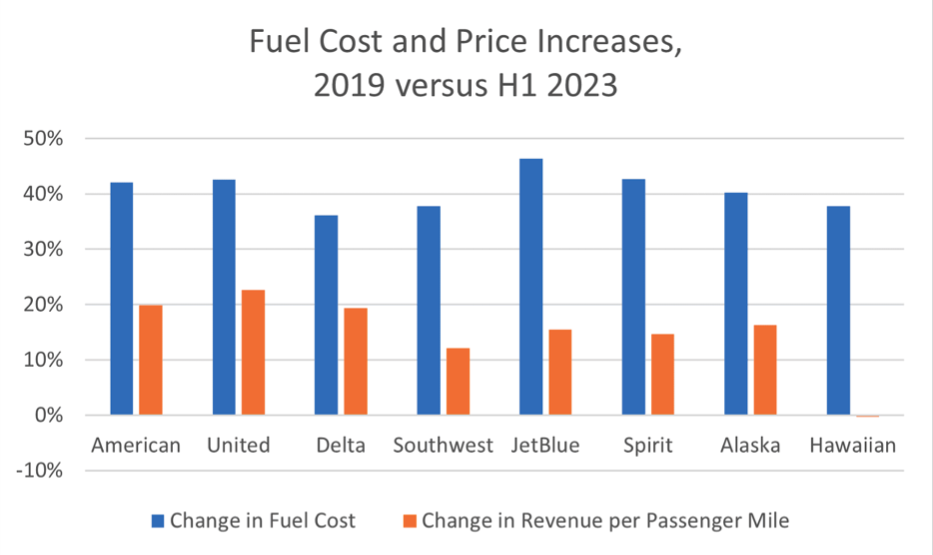
The ability to pass on higher fuel costs to consumers has differed by airline. Between 2019 and the first half of 2023 all airlines have seen a ~40% increase in fuel costs. The 3 largest airlines; American, United, and Delta have increased their ticket prices by ~20% during the same period. The smaller airlines have had more modest price increases. In particular, Hawaiian has not increased prices at all since 2019 and their operating margins have suffered as a result.
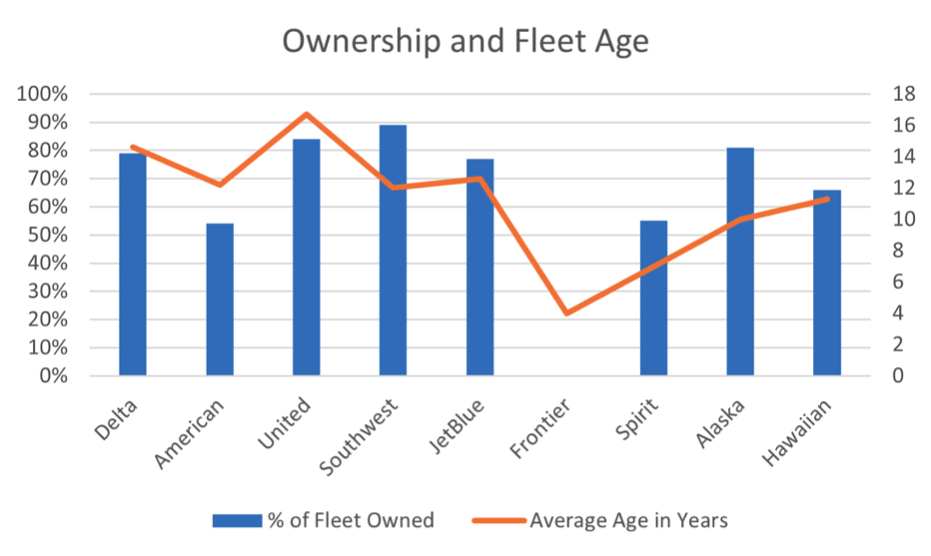
Another aspect to consider is the fleet of each airline. Airlines can either lease or buy their aircraft. Leasing is generally more expensive in the long-run but has the major advantage of allowing the airline to maintain a newer fleet. Newer airplanes tend to be more fuel efficient and need less maintenance. Frontier leases its entire aircraft fleet which allows it to maintain almost exclusively newer planes with an average age of just 4 years. United has the oldest fleet at 16.7 years. It also owns the vast majority of its planes. Thus, United will likely need to spend heavily on new planes over the coming years.
Differentiated Analytics Proprietary Data
We collect ticket price data for the 9 most important publicly traded US airlines; Southwest, United, American, Delta, JetBlue, Spirit, Frontier, Alaska, and Sun Country. With this data we maintain proprietary ticket price indices to monitor the health of the overall US airline market as well for each individual airline. Airline ticket prices are highly seasonal. Prices tend to be elevated around holidays when there is a lot of demand for tourism. For example, in the below price index of the total US airline industry you can see a massive spike in mid-December leading up to the Christmas holidays.
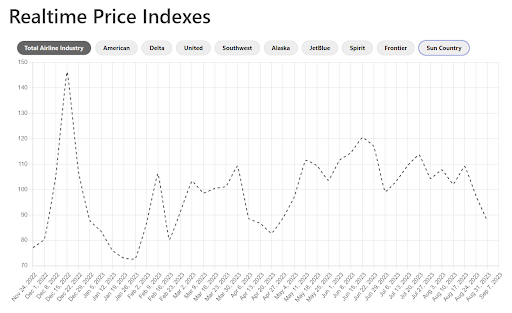
We can also compare the relative pricing of each airline and how this changes over time. If a certain airline is raising its ticket prices more-so than others, this is generally a good sign. It is an indication of increased demand for that airline, either because it happens to fly routes that are doing well, or because consumers have grown more fond of that particular airline.
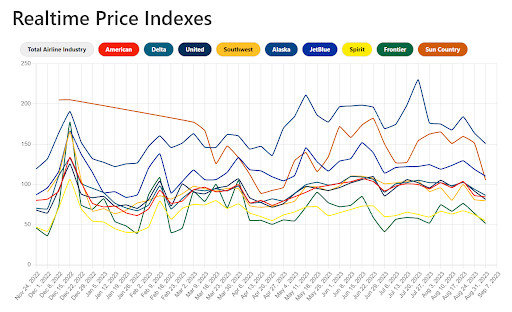
Note that the relative index values may differ from the revenue per passenger mile for a variety of factors. For example, Southwest generates significantly less revenue per passenger mile than American, Delta, or United yet its relative price index is about the same. The discrepancy is explained by the fact that Southwest does not offer business or first class seats. So while their basic economy fares are similar to the big 3 national carriers, the average revenue per passenger mile for the big 3 airlines is pushed up by their high-priced business and first class seats. Thus, looking at the revenue per passenger miles alone will give an incomplete picture of the competitive landscape. It is more useful to look at the changes in the relative price indices over time to get an apples-to-apples comparison. And we do this with our quarterly airline revenue estimate.
Revenue Forecast
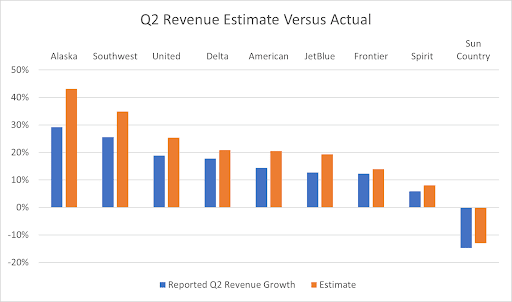
Our real-time price indices allow us to create revenue forecasts for each airline before they publish their quarterly results, which is usually a major catalyst for the share price. We have been testing our revenue estimates against subsequently reported domestic passenger revenue for each of their airlines we cover.
In July of 2023 we created our Q2 2023 revenue estimate for each airline. There was a 92% correlation between our estimates and the actual results, yielding a statistically significant p-value of 0.04%. Our revenue estimate is an invaluable tool for airline investors as they position their portfolios ahead of each earnings season.
Limitations of Data
While we are pleased to see statistically and economically significant correlations between our real-time price tracker and reported results, it is important to understand the limitations of our data. Firstly, we only track domestic airlines routes so our estimates are only relevant for predicting domestic revenue. Many of the airlines we track also fly international routes which we do not estimate. Furthermore, many airlines also generate cargo revenue, which we do not estimate. Secondly, we do not track real-time passenger volume by airline. If the volume of passengers flown by an airline differs dramatically from its seasonally-adjusted trend this may decrease the accuracy of our estimates. Finally, we only track basic economy ticket prices. If there are substantial price changes for business and first class tickets relative to basic economy pricing, our revenue estimates will not capture this. Our revenue estimates should not be construed as exact predictors, but instead directional predictors that can give a rough indication of the health of the airline industry as well as the relative performance of each airline before they report earnings.